Trial event figure maker
This function makes a picture like this:
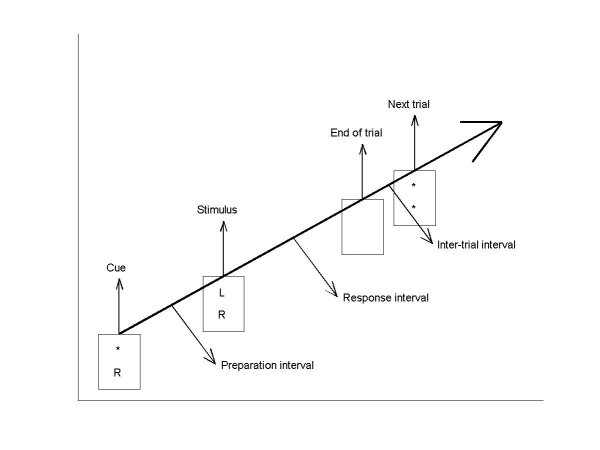
I wrote this because I was too lazy to do it by hand :) You set it up using a task_specs structure illustrated as the default in the m-file. The stimulus displays would probably require most extra work of course.
As always, remember to save the figure in a suitable format (e.g. tiff) if you plan on ever having it printed!
function task_figure(varargin)

% function task_figure(task_specs, angle)
%
% task_specs.times [ms]
% task_specs.names
% task_specs.interval_names
% task_specs.stim
% task_specs.plotting.eventArrowLength;
% task_specs.plotting.screenSize;
% task_specs.plotting.plotside;
%
% Thomas Edward Gladwin, June 2006. thomasgladwin@hotmail.com
%

if length(varargin) >= 1,
    task_specs = varargin{1};
else,
    task_specs = [];
end;
if isempty(task_specs),
    task_specs.times = [0 1500 3500 4250 5500];

    task_specs.names{1} = 'Cue';
    task_specs.names{2} = 'Stimulus';
    task_specs.names{3} = 'End of trial';
    task_specs.names{4} = 'Next trial';
    task_specs.names{5} = [];

    task_specs.interval_names{1} = 'Preparation interval';
    task_specs.interval_names{2} = 'Response interval';
    task_specs.interval_names{3} = 'Inter-trial interval';
    task_specs.interval_names{4} = [];

    task_specs.stim{1} = {'*' 'R'};
    task_specs.stim{2} = {'L' 'R'};
    task_specs.stim{3} = {' '};
    task_specs.stim{4} = {'*' '*'};
    task_specs.stim{5} = [];

    task_specs.plotting.eventArrowLength = 0.1;
    task_specs.plotting.screenSize = 0.1;
    task_specs.plotting.plotside = 600;
end;

if length(varargin) >= 2,
    angle = varargin{2};
else
    angle = pi / 8;
end;

conditionNames = fieldnames(task_specs);
t0 = task_specs.times(1);
t_end = task_specs.times(end);
t_buffer = 0; %0.1 * (t_end - t0);
t0 = t0 - t_buffer;
t_end = t_end + t_buffer;
timeLineX = [t0 t_end * cos(angle)];
timeLineY = [t0 t_end * sin(angle)];
timeLineL = sqrt(diff(timeLineX) .^ 2 + diff(timeLineY) .^ 2);

figure(1); clf; hold on;
minx = timeLineX(1) - 0.1 * abs(diff(timeLineX));
maxx = timeLineX(2) + 0.1 * abs(diff(timeLineX));
miny = timeLineY(1) - 1.2 * task_specs.plotting.screenSize * timeLineL;
maxy = timeLineY(2) + 1.6 * task_specs.plotting.eventArrowLength * timeLineL;
XLim(sort([minx maxx]));
YLim(sort([miny maxy]));
set(gca, 'XTick', []);
set(gca, 'YTick', []);
fprintf('Now stretch to beautifulness\n');
dx = diff(xlim);
dy = diff(ylim);
pos = get(gcf, 'Position');
if dx > dy,
    pos = [25 25 task_specs.plotting.plotside task_specs.plotting.plotside * dy / dx];
else,
    pos = [25 25 task_specs.plotting.plotside * dx / dy task_specs.plotting.plotside];
end;
set(gcf, 'Position', pos);

time_line = plot(timeLineX, timeLineY, 'k-'); set(time_line, 'LineWidth', 2);
arrow(timeLineX, timeLineY, 0.1, pi/8, [0 0 0], '-', 2);

% Events
for iScreen = 1:length(task_specs.names),
    screenX = timeLineX(1) + diff(timeLineX) * (task_specs.times(iScreen) + t_buffer) / (t_end + t_buffer);
    screenY = timeLineY(1) + diff(timeLineY) * (task_specs.times(iScreen) + t_buffer)/ (t_end + t_buffer);
    if ~isempty(task_specs.names{iScreen}),
        x = [screenX screenX]
        y = [screenY screenY + task_specs.plotting.eventArrowLength * timeLineL]
        arrow(x, y, 0.2, pi/8, [0 0 0], '-', 1);
        % once for extent...
        t = text(x(2), y(2), task_specs.names{iScreen});
        ext = get(t, 'Extent');
        xshift = ext(3) / 2;
        yshift = ext(4) / 2;
        set(t, 'Visible', 'off');
        t = text(x(2) - xshift, y(2) + yshift, task_specs.names{iScreen});
    end;
end;

% interval names
for iScreen = 1:length(task_specs.interval_names)
    screenX1 = timeLineX(1) + diff(timeLineX) * (task_specs.times(iScreen) + t_buffer) / (t_end + t_buffer);
    screenY1 = timeLineY(1) + diff(timeLineY) * (task_specs.times(iScreen) + t_buffer)/ (t_end + t_buffer);
    screenX2 = timeLineX(1) + diff(timeLineX) * (task_specs.times(iScreen + 1) + t_buffer) / (t_end + t_buffer);
    screenY2 = timeLineY(1) + diff(timeLineY) * (task_specs.times(iScreen + 1) + t_buffer)/ (t_end + t_buffer);
    screenX = mean([screenX1 screenX2]);
    screenY = mean([screenY1 screenY2]);
    if ~isempty(task_specs.interval_names{iScreen}),
        screenSize0 = task_specs.plotting.screenSize * timeLineL;
        intArrowLength = 1.5 * screenSize0;
        x = [screenX screenX + cos(pi / 4) * intArrowLength];
        y = [screenY screenY - sin(pi / 4) * intArrowLength];
        arrow(x, y, 0.2, pi/8, [0 0 0], '-', 1);
        % once for extent...
        t = text(x(2), y(2), task_specs.interval_names{iScreen});
        ext = get(t, 'Extent');
        xshift = ext(3) / length(task_specs.interval_names{iScreen});
        yshift = ext(4) / length(task_specs.interval_names{iScreen});
        set(t, 'Visible', 'off');
        t = text(x(2) + xshift, y(2) - yshift, task_specs.interval_names{iScreen});
    end;
end;

% screens
for iScreen = length(task_specs.names):(-1):1,
    screenX = timeLineX(1) + diff(timeLineX) * (task_specs.times(iScreen) + t_buffer) / (t_end + t_buffer);
    screenY = timeLineY(1) + diff(timeLineY) * (task_specs.times(iScreen) + t_buffer)/ (t_end + t_buffer);
    if ~isempty(task_specs.stim{iScreen}),
        screenSize0 = task_specs.plotting.screenSize * timeLineL;
        pos = [screenX - screenSize0 / 2 screenY - screenSize0 screenSize0 screenSize0];
        verticesX = [pos(1); pos(1) + pos(3); pos(1) + pos(3); pos(1)];
        verticesY = [pos(2); pos(2); pos(2) + pos(4); pos(2) + pos(4)];
        fill(verticesX, verticesY, [1 1 1]);
        rect0 = rectangle('Position', pos);
        nStim = length(task_specs.stim{iScreen});
        for iStim = 1:nStim,
            x0 = pos(1) + pos(3) / 2;
            dStim = 0.8 * pos(4) / nStim;
            y0 = (pos(2) + 0.9 * pos(4)) - dStim * iStim;
            % once for extent...
            t = text(x0, y0, task_specs.stim{iScreen}{iStim});
            ext = get(t, 'Extent');
            xshift = ext(3) / 2;
            yshift = ext(4) / 2;
            set(t, 'Visible', 'off');
            t = text(x0 - xshift, y0 + yshift, task_specs.stim{iScreen}{iStim});
        end;
    end;
end;

function arrow(varargin)

% function arrow(x0, y0, r, angle, arrowheadsize, arrowheadangle, colorvec, linestyle, linewidth)
% function arrow(x_comp, y_comp, arrowheadsize, arrowheadangle, colorvec, linestyle, linewidth)
%
% x_comp and y_comp must contain two values.
% Trailing plotting parameters may be ommitted. Any plotting parameter can be specified as [] for defaults.

axes0 = gca;
if length(varargin{1}) == 1,
    x0 = varargin{1};
    y0 = varargin{2};
    r = varargin{3};
    angle = varargin{4};
    x_comp = [x0 x0 + r * cos(angle)];
    y_comp = [x0 x0 + r * sin(angle)];
    plotParIndex = 5;
else,
    x_comp = varargin{1};
    y_comp = varargin{2};
    r = sqrt(diff(x_comp) .^ 2 + diff(y_comp) .^ 2);
    angle = atan2(diff(y_comp), diff(x_comp));
    plotParIndex = 3;
end;

if length(varargin) >= plotParIndex,
    headSize = varargin{plotParIndex} * r;
    if isempty(headSize ),
        headSize = 0.1 * r;
    end;
else,
    headSize = 0.1 * r;
end;
if length(varargin) >= plotParIndex + 1,
    headAngle = varargin{plotParIndex + 1};
    if isempty(headAngle),
        headAngle = pi / 8;
    end;
else,
    headAngle = pi / 8;
end;
if length(varargin) >= plotParIndex + 2,
    color = varargin{plotParIndex + 2};
    if isempty(color),
        color = [0 0 0];
    end;
else,
    color = [0 0 0];
end;
if length(varargin) >= plotParIndex + 3,
    linestyle = varargin{plotParIndex + 3};
    if isempty(linestyle),
        linestyle = '-';
    end;
else,
    linestyle = '-';
end;
if length(varargin) >= plotParIndex + 4,
    linewidth = varargin{plotParIndex + 4};
    if isempty(linewidth),
        linewidth = 0.1;
    end;
else,
    linewidth = 0.1;
end;

holding = get(axes0, 'NextPlot');
if strcmp(holding, 'replace') == 1,
    cla;
end;
%set(axes0, 'NextPlot', 'add');

% The main line
drawLine(x_comp, y_comp, color, linestyle, linewidth);

% The head: draw on origin on a lying arrow, then rotate and translate.
headPoint = getHeadPoint(angle, headSize, headAngle, x_comp, y_comp);
drawLine([x_comp(2) headPoint(1)], [y_comp(2) headPoint(2)], color, linestyle, linewidth);
headPoint = getHeadPoint(angle, headSize, -headAngle, x_comp, y_comp);
drawLine([x_comp(2) headPoint(1)], [y_comp(2) headPoint(2)], color, linestyle, linewidth);

% whitespace if necessary
xlim1 = [min(x_comp - headSize) max(x_comp + headSize)];
ylim1 = [min(y_comp - headSize) max(y_comp + headSize)];
xlim0 = get(gca, 'XLim');
ylim0 = get(gca, 'YLim');
xlim2 = [min([xlim0(1); xlim1(1)]) max([xlim0(2); xlim1(2)])];
ylim2 = [min([ylim0(1); ylim1(1)]) max([ylim0(2); ylim1(2)])];
set(gca, 'XLim', xlim2);
set(gca, 'YLim', ylim2);

%set(axes0, 'NextPlot', holding);

function line0 = drawLine(x_comp, y_comp, color, linestyle, linewidth);
line0 = line(x_comp, y_comp);
set(line0, 'Color', color);
set(line0, 'LineStyle', linestyle);
set(line0, 'LineWidth', linewidth);

function headPoint = getHeadPoint(angle, headSize, headAngle, x_comp, y_comp)
headPoint = headSize * [-cos(headAngle); sin(headAngle)];
rotation_matrix = [cos(angle) -sin(angle); sin(angle) cos(angle)];
headPoint = rotation_matrix * headPoint + [x_comp(2); y_comp(2)];