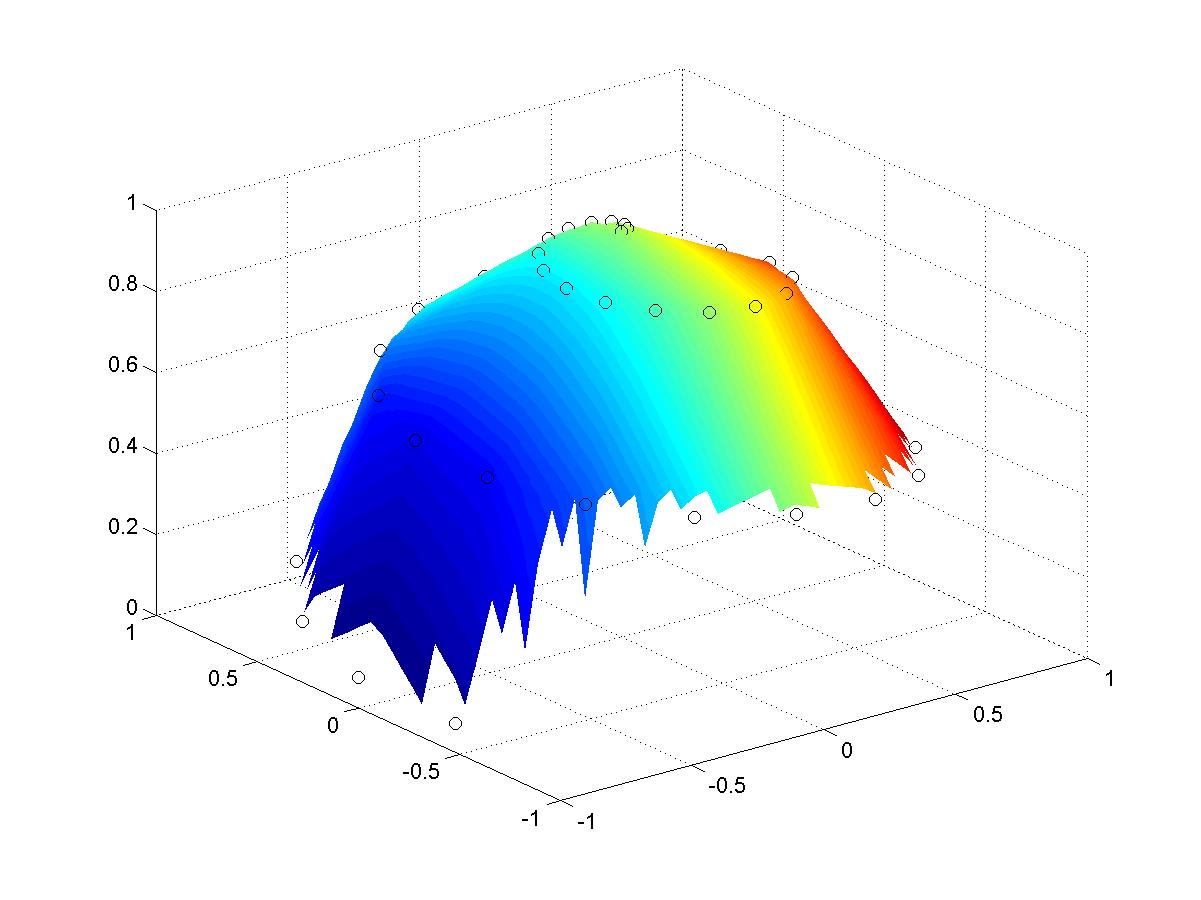
3-D color-coded surface plot
The standard surf etc functions have kind of unintuitive input demands, this is just a shell in which you input x, y and z vectors and a value vector. Gets you pictures like this, positions and values generated with the simulation program, sim_elPos. To run, first input: electrode = sim_elPos(42); then use the fields of electrode as inputs to tg_surf3d as follows: tg_surf3d(electrode.x, electrode.y, electrode.z, electrode.value).
function tg_surf3d(x, y, z, v)

R = max([abs(x(:)); abs(y(:))]);
space = -R:0.05:R;
[XI,YI] = meshgrid(space,space);
ZI = griddata(x,y,z,XI,YI);
VI = griddata(x,y,v,XI,YI);
surf(XI,YI,ZI, VI);
shading('interp');
hold on;
plot3(x, y, z, 'ko');
function [electrode] = sim_elPos(nElectrodes)

R = 1;
for iElec = 1:nElectrodes,
    electrode.r(iElec) = R;
    electrode.horHoek(iElec) = 2 * pi * (1 / 16) * (iElec - 1);
    electrode.vertHoek(iElec) = pi / 2 - (pi / 2) * (iElec - 1) / nElectrodes;
    projectionL = cos(electrode.vertHoek(iElec)) * electrode.r(iElec);
    electrode.x(iElec) = cos(electrode.horHoek(iElec)) * projectionL;
    electrode.y(iElec) = sin(electrode.horHoek(iElec)) * projectionL;
    electrode.z(iElec) = sin(electrode.vertHoek(iElec)) * electrode.r(iElec);
end;
electrode.value = electrode.x;