Roadwarrior3
This function makes a picture like below, and saves the information about segments of the road:
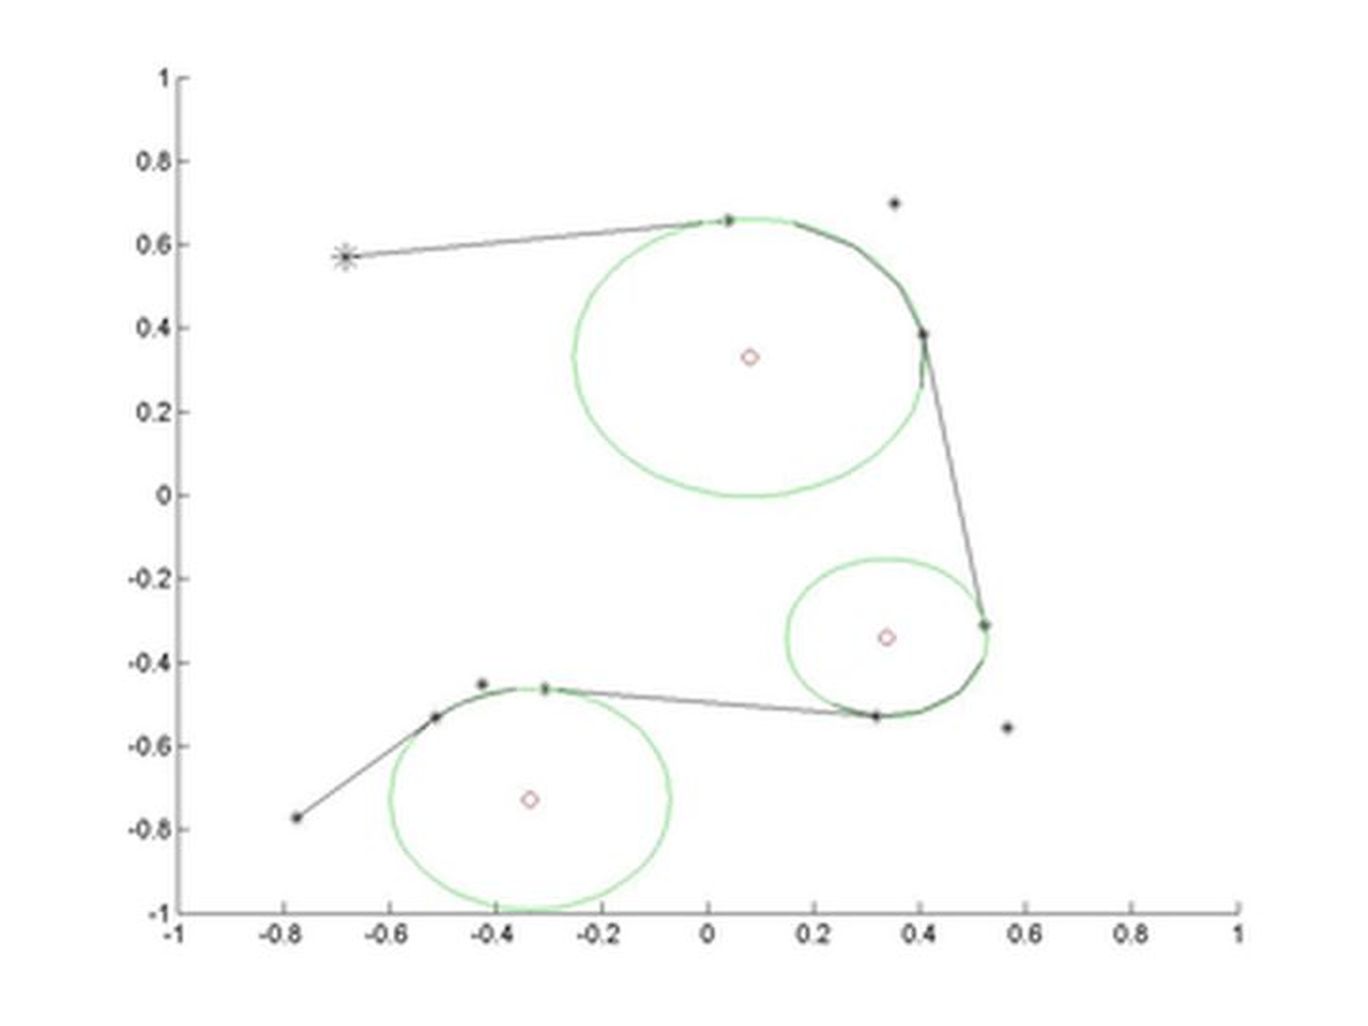
To start the program, just run the roadwarrior3 function in Matlab with no arguments. You click on the figure to place points on the road; you can click on an existing point to remove it (when you're near an existing point, it turns red and will be removed when clicked). Once there are three or more points, the smooth road is drawn. Corners are replaced by parts of circles so that the direction of the road changes smoothly. Clicking on the first point again closes the circuit if desired. An optional nx2 matrix with precalculated coordinates of points on the road can be given, example here.
Download the m-files here.
function curveInfo = roadwarrior3(varargin)

% A --- F --- E ===> A --- B u C --- E
global curveInfo coords figindex selectedCoord lastSelectedCoord closeCrit lockImage;
figindex = figure;
if length(varargin) > 0,
    coords = varargin{1};
    lockImage = 1;
else,
    coords = [];
    lockImage = 0;
end;
curveInfo = [];
selectedCoord = 0;
lastSelectedCoord = 0;
clf;
set(gcf, 'Position', [50, 50, 500, 500]);
set(gcf, 'WindowButtonDownFcn', @addRemCoord);
set(gcf, 'WindowButtonMotionFcn', @motion);
xlim([-1 1]);
ylim([-1 1]);
xl = get(gca, 'XLim');
yl = get(gca, 'YLim');
closeCrit = max(diff(xl), diff(yl)) / 20;
hold on;
if ~isempty(coords),
    plotCoords;
    roundEmUp(coords);
end;

function plotCoords
global coords figindex selectedCoord lastSelectedCoord lockImage;
if lockImage == 1,
    return;
end;
figure(figindex);
cla;
x = coords(:, 1);
y = coords(:, 2);
for n = 1:length(coords(:, 1)),
    if selectedCoord == n,
        p = plot(x(n), y(n), '*r');
    else,
        p = plot(x(n), y(n), '*k');
    end;
    ms0 = get(p, 'Markersize');
    if n == 1,
        set(p, 'Markersize', 2 * ms0);
    end;
end;

function motion(dum1, dum2)
getCurrentClosest;

function getCurrentClosest
global coords figindex selectedCoord lastSelectedCoord closeCrit;
if isempty(coords),
    return;
end;
figure(figindex);
p = get(gca, 'CurrentPoint');
p = [p(1, 1) p(1, 2)];
lastSelectedCoord = selectedCoord;
selectedCoord = 0;
for n = 1:length(coords(:, 1)),
    if leng(p(1) - coords(n, 1), p(2) - coords(n, 2)) < closeCrit,
        selectedCoord = n;
    end;
end;
if lastSelectedCoord == selectedCoord,
    return;
end;
plotCoords;
plotCurve;

function addRemCoord(dum1, dum2)
global coords figindex selectedCoord closeCrit lockImage;
lockImage = 0;
p = get(gca, 'CurrentPoint');
p = [p(1, 1) p(1, 2)];
deleting = 0;
if ~isempty(coords),
    % allow closure
    if length(coords(:, 1)) > 1,
        start = 2;
    else,
        start = 1;
    end;
    for n = start:length(coords(:, 1)),
        if n == selectedCoord,
            coords(n, :) = [];
            deleting = 1;
            break;
        end;
    end;
end;
if deleting == 0,
    if ~isempty(coords),
        if leng(p(1) - coords(1, 1), p(2) - coords(1, 2)) < closeCrit,
            p = coords(1, :);
        end;
    end;
    coords = [coords; p];
    selectedCoord = length(coords(:, 1));
end;
getCurrentClosest;
plotCoords;
roundEmUp(coords);

function roundEmUp(coords)
global curveInfo

if length(coords(:, 1)) < 3,
    return;
end;

x = coords(:, 1);
y = coords(:, 2);
cutProp = 0.25;

% check for closure
closure = 0;
if x(1) == x(end) & y(1) == y(end) & length(x) > 1,
    closure = 1;
    x = [x; x(2)];
    y = [y; y(2)];
end;

% Create curveInfo
% curveInfo: [0 x0 y0 x1 y1 0 0]
% curveInfo: [1 x0 y0 rad arc xc yc]
curveInfo = [];
for n = 2:(length(x) - 1),
    % point n will be rounded if necessary
    Dx1 = diff(x([(n - 1) n]));
    Dy1 = diff(y([(n - 1) n]));
    Dx2 = diff(x([n (n + 1)]));
    Dy2 = diff(y([n (n + 1)]));
    L1 = leng(Dx1, Dy1);
    L2 = leng(Dx2, Dy2);
    dx1 = x(n) - x(n - 1);
    dy1 = y(n) - y(n - 1);
    dx2 = x(n + 1) - x(n);
    dy2 = y(n + 1) - y(n);
    rca1 = atan2(dy1, dx1);
    rca2 = atan2(dy2, dx2);
    if rca1 == rca2,
        curveInfo = [curveInfo; 0 x(n - 1) y(n - 1) x(n) y(n) 0 0]
        continue;
    end;
    % AB
    cutL = cutProp * L2;
    if cutL > L1,
        cutL = cutProp * L1;
    end;
    Bx = x(n - 1) + cos(rca1) * (L1 - cutL);
    By = y(n - 1) + sin(rca1) * (L1 - cutL);
    curveInfo = [curveInfo; 0 x(n - 1) y(n - 1) Bx By 0 0];
    Cx = x(n + 1) - cos(rca2) * (L2 - cutL);
    Cy = y(n + 1) - sin(rca2) * (L2 - cutL);
    % circle touching B, C
    % find crossing point of perpendiculars from B and C, in directions AB
    % and CE
    dxp1 = -dy1;
    dyp1 = dx1;
    dxp2 = -dy2;
    dyp2 = dx2;
    % draw perps
    figure(1); hold on; tv = (-0.2):0.1:0.2;
    plot(Bx + tv * dxp1, By + tv * dyp1, 'r:');
    plot(Cx + tv * dxp2, Cy + tv * dyp2, 'r:');
    % find tcr: crossing point scaler
    % Bx + tcr * dxp1 == Cx + qcr * dxp2
    % By + tcr * dyp1 == Cy + qcr * dyp2
    weights = [dxp1, -dxp2; dyp1, -dyp2];
    weighted = [Cx - Bx; Cy - By];
    scalers = weights \ weighted;
    tcr = scalers(1);
    xc = Bx + tcr * dxp1;
    yc = By + tcr * dyp1;
    r = leng(xc - Bx, yc - By);
    dBC = leng(Bx - Cx, By - Cy);
    arc = 2 * asin((dBC / 2) / r);
    % sign of arc
    phiB = atan2(By - yc, Bx - xc);
    postest = leng(xc + r * cos(phiB + arc) - Cx, yc + r * sin(phiB + arc) - Cy);
    negtest = leng(xc + r * cos(phiB - arc) - Cx, yc + r * sin(phiB - arc) - Cy);
    if postest < negtest,
        arcsign = 1;
    else,
        arcsign = -1;
    end;
    arc = arcsign * arc;
    curveInfo = [curveInfo; 1 Bx By r arc xc yc];
    % CD
    % curveInfo = [curveInfo; 0 Cx Cy x(n + 1) y(n + 1) 0 0];
    % replace coordinates
    x(n) = Cx;
    y(n) = Cy;
    % end-line
    if n == length(x) - 1,
        curveInfo = [curveInfo; 0 x(n) y(n) x(n + 1) y(n + 1) 0 0]
    end;
end;
if closure == 1,
    curveInfo(1, [2 3]) = curveInfo(end, [2 3]);
    curveInfo(end, [4 5]) = curveInfo(2, [2 3]);
end;
plotCurve;

function plotCurve
global figindex curveInfo;
if isempty(curveInfo),
    return;
end;
figure(figindex);
hold on;
for n = 1:length(curveInfo(:, 1)),
    if curveInfo(n, 1) == 0,
        x = curveInfo(n, [2 4]);
        y = curveInfo(n, [3 5]);
        plot(x, y, 'k*-');
    else,
        x0 = curveInfo(n, [2]);
        y0 = curveInfo(n, [3]);
        r = curveInfo(n, 4);
        arc = curveInfo(n, 5);
        xc = curveInfo(n, [6]);
        yc = curveInfo(n, [7]);
        plot(xc, yc, 'ro');
        xv = xc + ((-r):(r / 40):r);
        circ = yc + real(sqrt(r^2 - (xv - xc).^2));
        plot(xv, circ, 'g-');
        circ = yc - real(sqrt(r^2 - (xv - xc).^2));
        plot(xv, circ, 'g-');
        % black bit for actual road
        phi1 = atan2(y0 - yc, x0 - xc);
        nPhi = 4;
        dPhi = arc / nPhi;
        for iPhi = 1:nPhi,
            phi = phi1 + iPhi * dPhi;
            tempx0 = xc + r * cos(phi);
            tempy0 = yc + r * sin(phi);
            tempx1 = xc + r * cos(phi + dPhi);
            tempy1 = yc + r * sin(phi + dPhi);
            plot([tempx0 tempx1], [tempy0 tempy1], 'k-');
        end;
    end;
end;
xlim0 = get(gca, 'XLim');
ylim0 = get(gca, 'YLim');
squareLim = [min([xlim ylim]) max([xlim ylim])];
set(gca, 'XLim', squareLim);
set(gca, 'YLim', squareLim);

function l = leng(dx, dy)
l = sqrt(dx^2 + dy^2);